Cascade System Analysis Using Amplifier2 Behavioral Models in Keysight ADS®
This application note complements Mini-Circuits previous note, “Using Generalized Multi-Dimensional Data Files to Model Amplifier Temperature and DC Operating Point Dependence within the Amplifier2 Behavioral Model in ADS®”.
Mini-Circuits characterizes its amplifiers across multiple operating conditions, including temperature and DC bias, and publishes the resulting data in MDF- and S2D-compatible file formats.
These models are especially useful for system-level analysis, where multiple active and passive components interact to determine overall cascade performance.
To simplify this workflow, Mini-Circuits recommends creating a subcircuit for each behavioral model. These subcircuits can then be accessed from the Workspace Library in the Component Library and reused in the final system-level cascade schematic.
The remainder of this note describes how to create these subcircuits and use them in a cascade design.
Creating a Subcircuit Schematic
Start with the original schematic used to create and analyze the Amplifier2 behavioral model for the selected Mini-Circuits amplifier.
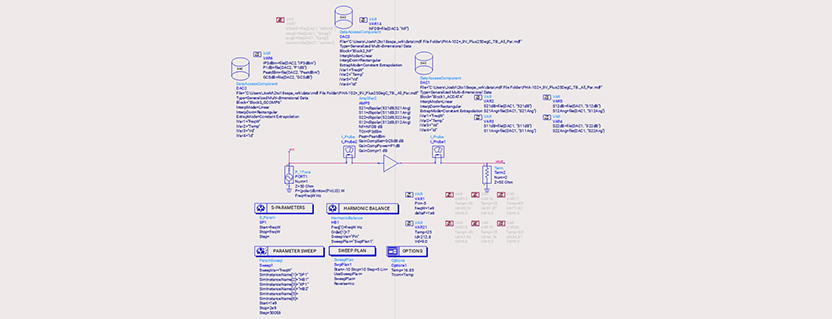
For example, Figure 1 shows the schematic used to model the PHA-102+ with the Amplifier2 behavioral model. All required DAC and simulation components are included.

Figure 1: Amplifier2 Behavioral Model Schematic for the PHA-102+.
As Figure 1 illustrates, attempting to cascade multiple models within a single system-level schematic can quickly become difficult to read and inefficient to manage.
One approach for converting the schematic in Figure 1 into a reusable subcircuit is outlined below:
- Use the mouse to select every element except the excitation, termination, and simulation-controller components.
- Using Figure 2 as a guide, select Edit, Component, and then Create Hierarchy.
- In the pop-up dialog shown in Figure 3, enter the subcircuit Cell Name.
- Hint: Perform the above steps on a copy of the original schematic so as not to lose the original version.

Figure 2: Steps for Creating a Subcircuit from the Amplifier2 Behavioral Model Schematic.

Figure 3: Pop-up for Generating Subcircuit Cell Name.
Figure 4 shows an example of the resulting subcircuit, which can then be reused as a compact building block in higher-level cascade schematics.

Figure 4: Subcircuit for PMA3-83LN+ using Amplifier2 Behavioral Model.
The independent variables of each subcircuit are initialized and activated using the parameters defined in the Var Eqn Data Item blocks. For example, Figure 4 shows that the analysis is performed at +85 °C and a supply voltage of +5 V.
Subcircuits created in this manner appear in the ADS main window, as shown in Figure 5.

Figure 5: Available Subcircuits Listed Under ADS (Main) Window.
The symbol representing the subcircuit can be edited by double-clicking the symbol icon in the ADS main window. Figure 6 shows an example of a two-port symbol.

Figure 6: 2-Port Subcircuit Symbol.
Creating the System-Level Schematic for Cascade Analysis
Once the individual amplifier subcircuits have been created, they can be assembled into a system-level cascade schematic for performance analysis.
Figure 7 shows the ADS schematic for a cascade of three Mini-Circuits Amplifier2 behavioral models configured for single-tone analysis.

Figure 7: Single Tone Behavioral Model for a Cascade of Three Mini-Circuits Amplifiers.
Using the schematic in Figure 7, the gain and compression behavior of each stage can be evaluated as the signal moves through the cascade. The following figures show the modeled performance at key reference points:
- Figure 8: First-stage performance.
- Figure 9: Cascaded performance of the first and second stages.
- Figure 10: Cascaded performance of all three stages.
Single-Tone ADS Simulation Results
Figures 8 through 10 present single-tone simulation results for gain and output power as functions of input power at +25 °C.

Figure 8: 1st Stage Output Power (y-axis) and Gain (right y-axis) vs Input Power.

Figure 9: 1st and 2nd Stage Output Power (y-axis) and Gain (right y-axis) vs Input Power.

Figure 10: 1st, 2nd and 3rd Stage Output Power (y-axis) and Gain (right y-axis) vs Input Power.
Together, these plots show how gain and output power evolve from stage to stage, making it easier to identify where compression begins to limit overall cascade performance.
Two-Tone ADS Schematic Using the Amplifier2 Behavioral Model
Figure 11 shows the ADS schematic for a cascade of three Mini-Circuits Amplifier2 behavioral models configured for two-tone analysis.

Figure 11: Two-Tone Behavioral Model for a Cascade of Three Mini-Circuits Amplifiers.
The schematic is similar to the one shown in Figure 7, but the input source now includes two tones, P[1] and P[2]. The power level of each tone is controlled by the sweep variable SweepVar = “Pin”, which is swept by SwpPlan1 from -50 dBm to -30 dBm per tone. The required ADS simulation elements are shown in Figure 12.

Figure 12: Simulation Controller and Parameter Sweep Definitions.
Two-Tone ADS Simulation Results
Figure 13 presents two-tone simulation results for third-order output distortion in a spectrum-analyzer format. The simulation was run at 2 GHz ± 1 MHz with Temp = +25 °C, and the results are plotted as a function of input power.

Figure 13: Simulated Two-Tone Third-Order Distortion as a Function of Input Power.
Two-tone analysis is useful for evaluating intermodulation behavior and estimating the output third-order intercept point (IP3out) across the cascade.
The output third-order intercept point (IP3out) can be estimated from the data in Figure 13 using Equation 1.
Eqn1: IP3out(dBm) = Pout/Tone(dBm) + delta(dB)/2
with delta = Pout/Tone(dBm) – PIP3/Tone(dBm)
In this expression, PIP3/Tone is the power level of the third-order intermodulation product.
As an example, Equation 1 can be applied to the trace markers in Figure 13 at two output power levels:
- Example 1: Pout/Tone (m13) = 23.19 dBm, PIP3/Tone (m10) = 9.65 dBm, and delta = m13 – m10 = 13.54 dB. Therefore, IP3out = 23.19 dBm + 13.54 dB/2 = 29.96 dBm.
- Example 2: Pout/Tone (m11) = 8.37 dBm, PIP3/Tone (m12) = -54.60 dBm, and delta = m11 − m12 = 63.00 dB. Therefore, IP3out = 8.37 dBm + 63 dB/2 = 39.86 dBm.
These values match those calculated in the ADS Data Display.
Because applying Equation 1 manually can be cumbersome, ADS also provides a built-in IP3out simulation component and associated measurement functions, as shown in Figure 14.

Figure 14: ADS Built-In Simulation Component for 3rd Order Output Intercept Point.
Figure 15 shows the results produced by the built-in IP3out simulation component, which agrees with the manual calculations.

Figure 15: IP3out Built-In Simulation Component Results.
To examine how the third-order intercept point changes as the signal progresses through the cascade, two additional IP3out components can be defined, as shown in Figure 16.

Figure 16: IP3out Simulation Components Defined for the 1st and 2nd Stages.
Both components are shown for illustration, but only one IP3out component can be active at any given time in a simulation. Figures 17 and 18 show the corresponding results for the first and second stages, respectively.

Figure 17: IP3out Built-In Simulation Component Results for 1st Stage.

Figure 18: IP3out Built-In Simulation Component Results for 2nd Stage.
The power levels of the third-order distortion products can also be tracked as they propagate through the cascade using the equations defined in Figure 19.

Figure 19: Third-Order Distortion Products at the Outputs of the 1st and 2nd Stages.
Conclusion
Mini-Circuits characterizes its amplifiers across multiple operating conditions, including temperature and DC bias, and publishes the resulting data in a single MDF- or S2D-compatible file format.
- Cascaded amplifier systems often include both active and passive components that affect overall performance.
- Amplifier2 multi-dimensional data files and discrete S-parameter files support this type of system-level analysis in Keysight ADS®.
- However, building a cascade schematic directly from multiple Amplifier2 behavioral models can be difficult to manage.
To simplify this workflow, Mini-Circuits has shown how to create reusable subcircuit schematics for each behavioral model and assemble them into a final system-level cascade schematic.
Simulation results for a cascade of three Mini-Circuits amplifiers were presented for both single-tone and two-tone conditions.
This approach improves schematic reusability, simplifies system-level analysis, and provides a practical framework for evaluating gain, compression, and intermodulation performance in cascaded amplifier designs.
Get in touch for orders or any queries: sales@rfdesign.co.za / +27 21 555 8400
Courtesy of Mini-Circuits